
Quote of the Day
Successful ... politicians are insecure and intimidated men. They advance politically only as they placate, appease, bribe, seduce, bamboozle or otherwise manage to manipulate the demanding and threatening elements in their constituencies.
— Walter Lippmann
Introduction

Figure 1: 18650 Lithium -Ion
Cylindrical Battery (right)
versus a standard AA battery
(left). (Source)
I frequently am asked to comment on data that other engineers send me. This morning I received some test data obtained from an engineer measuring the backup time of an Uninterruptible Power Source (UPS) containing multiple lithium-ion (Li-Ion) batteries. The engineer was disappointed with the backup time provided by this UPS and wanted to know if his test results were reasonable considering the battery capacity of the UPS. While there were numerous circuit parameters measured during this testing, the critical information was the battery voltage versus time.
The engineer's routine calculations showed that the UPS should provide 4 hours of backup time, but he measured 2.7 hours. While batteries are listed with a nominal charge capacity, their actual capacity varies strongly with the load presented to the battery. His testing was performed at room temperature and with a load of 0.8 A.
In this post, I will show that his test results are reasonable when when the effects of the load current are taken into account. I will perform the calculations three ways:
- Method 1: Simple capacity/load modeling (ignoring current load on capacity).
- Method 2: Using a graphical curve of capacity versus load.
- Method 3: Using numerical methods for interpolating digitized capacity graphs.
Background
Definitions
- C-Rate
- C-rate is the charge/discharge current normalized to the battery capacity. A charge/discharge rate of one C for one hour draws a charge equal to the battery capacity. For example, the 1C discharge rate for a 2.2 A-hour battery is 2.2 A.
- Cutoff Voltage (VCutoff)
- The battery voltage at which the UPS terminates the discharge of the battery.
- Capacity
- The available charge in the battery, which is a function of the load current. A battery's charge capacity is generally specified at some low current draw. For example, the capacity of lead-acid batteries is specified at a 20 hour (C/20 or 0.05C) rate.
UPS Characteristics
Here are the key facts about this UPS:
- It contains 4 series-connected, Li-Ion, 18650 cylindrical batteries (Figure 1).
- These batteries have a nominal cell voltage of 3.7 V.
- I assume that each 18650 battery is rated to have a nominal 2800 mA-hour charge capacity. The actual rating is 2700 mA-hour (minimum) and 2900 mA-hour (typical). I will average the two values for this analysis.
- The UPS load is a device that requires an input voltage between 10 V and 16 V.
- The voltage range requirement is met by connecting the batteries in series.
- The engineer modeled the load using 800 mA of constant current draw.
- Most UPS hardware stops discharging the battery at VCutoff, which for Li-Ion batteries is typically near 3.3. V. In this case, the UPS cutoff was ~2.9 V.
Analysis
Measured Battery Voltage Versus Time for Constant Load Current
Figure 2 shows the data that was emailed to me. I have literally seen hundreds of these test plots. This UPS I include a calculation on Figure 3 that shows that the charged cell voltage for the batteries in this 4 cell-string pack is 3.92 V. This is below the manufacturers 4.2 V charge voltage in their specification. The cutoff voltage is 2.87 V.

Figure 2: Raw Battery Data That Was Emailed To Me.
This data was measured by instrumenting the battery series inside the UPS. We will need the initial cell voltage and the final cell voltage in order to estimate the charge drawn from the battery.
Method 1 will not use this data, but Method 2 and 3 will.
Method 1: Simple Calculation Ignoring Load Current Impact on Capacity
Figure 3 shows how to estimate the backup time provided by this UPS assuming nominal battery characteristics.

Figure 3: Nominal Calculation Example.
The key problem with this analysis is that it assumes that the battery capacity does not depend on the load. I model the effect of load current on battery capacity any time the load currents exceed 0.1C.
Method 2: Graphical Analysis
Figure 4 shows how to compute the expected backup time using the battery's capacity versus load chart. All the calculations are shown on the graph and I obtain a backup time estimate of 2.8 hours.
The calculations shown on the graph can be described as follows:
- Us the initial cell voltage to determine how much charge is lost because the UPS did not fully charge the battery.
- Use the final cell voltage to determine how much charge is available from a fully charged battery.
- Determine the difference between the final and initial charge, which reflects the charge available for backup energy.
- Divide the available charge (in mA-hours) by the load current, which give the backup time.

Figure 4: Computing Run Time Using Capacity Chart.
Method 3 : Numerical Analysis
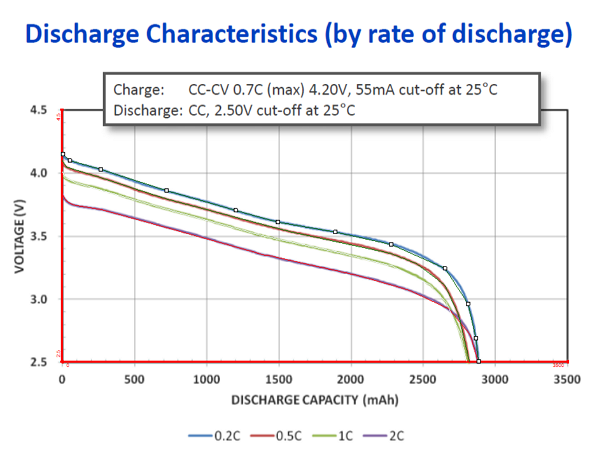
Manufacturer's Capacity Rating Versus Load
Figure 5 shows the typical discharge specification for Li-Ion battery from Panasonic with a nominal rating of 2900 mA-hour (2700 mA-hour minimum). As you can see in Figure 4, the typical capacity is measured when the battery has a minimal load (0.2C). One unusual aspect of this chart is that you also get full capacity with a high load current (2C). I only rarely see this characteristic on a capacity chart.

Figure 5: Discharge Capacity Versus Load Current.
I digitized this data using Dagra and pasted it into Mathcad. Figure 6 shows the digitized the data and a routine to interpolate the data. I will assume that batteries actual capacity is 2800 mA-hour, the mean of the minimum and maximum.

Figure 6: Digitized and Interpolated Charge Data.
Mathcad Model of Battery Capacity Data
Given the discharge data shown in Figure 7, I can determine the effective capacity of the UPS battery at a 0.8 A load. Figure 6 shows the my interpolated results for the manufacturer's data and my interpolation for a 0.8 A load. The graph shows that the effective battery capacity is ~2779 mA-hour with an initial charge voltage of 4.2 V. I also show that 554 mA of charge is missing if the battery is initially charged to only 3.92 V, which is this case. In the next section, I will show how to algebraically obtain these results.

Figure 7: Plot of Battery Capacity at 0.8 A Load (0.29C).
Estimated Discharge Time Assuming that Capacity is Load-Dependent
In Figure 8, I use 2-dimensional interpolation to compute the battery capacity assuming VCutoff = 3.3 V and ILoad = 0.8 A.

Figure 8: Calculation of Discharge Time (2.8 hours) Assuming a Load-Dependent Charge.
My calculated discharge time of 2.8 hours roughly agrees with the measured discharge time of 2.7 hours.
Conclusion
My estimate for the battery operating time is 2.8 hours with an 800 mA load. We actually measured 2.7 hours, so the estimate is ~4%. This is error is within reason for batteries – they are subject to individual variation.
Hi Marc, what exactly does the FillVec function you are using in Fig 5?
Hi Filip,
Sorry about missing that utility function. FillVec is a function I copied from the Mathcad master Tom Gutman. It fills a vector with incrementing numbers. I have updated Figure 5 to include that function. Thank you for finding this error.
mathscinotes
Thank you for this excellent analysis!
Possible typos: In the calculation block titled "Backup time for an 18650 Battery String", should 3.5V read 3.7V, and if so, the result will be different, because you do appear to have used 3.5V. If you did intend to use 3.5V, you don't explain why.
In the graph title "Figure 4 shows the typical discharge specification for 2200 mA-hour Li-Ion battery from Panasonic.", should "2200" read "2800"?
Hi Greg,
I should have used 3.7 V instead of 3.5 V. I have made the correction. You will see me use numbers between 3.5 and 3.7 because different vendors have different nominal voltage ratings. I just hadn't updated this section when we switched to Panasonic.
The battery capacity rating is actually 2700 (min), 2900 typical. I have updated the text to reflect that. I have also included a link in that paragraph to the Panasonic specification. Again, I use dozens of these batteries, each with different ratings. The text did not get updated when we switched batteries.
Thank you for the help on keeping my web site accurate.
mark
Also, how exactly was the raw discharge data obtained? Since you didn't use the actual cutoff voltage from that supplied graph, I assume that it was taken by measuring the battery string disconnected from the UPS - yes?
This blog post describes a worksheet used by my staff and me to interpolate battery data. The interesting part of the exercise is that the interpolation must be done in 2-dimensions because the effective capacity of the battery is a function of (1) the rate of discharge (load current); and (2) the cutoff voltage. The raw discharge data is obtained from the Panasonic specification (Figure 4). The specification only gives the discharge characteristics for 4 different battery loads (0.2C, 0.5C, 1C, and 2C). Because my load was different than they measured (i.e. 0.8C). I needed to interpolate the Panasonic data to obtain the battery capacity at my load and cutoff voltage. My intent here was to show my staff how to use Mathcad to interpolate 2D data. I can do something similar in Excel (more work), and I will put that on my list of candidate posts.
I ended up measuring the effective capacity in the UPS and it agreed within experimental error (I calculated 2.8 hours and measured 2.7 hours).
mark
Thanks Mark - yes - I understand why you do the 2-dimensional interpolation.
Regarding the raw data, I am referring to your figure 3. Your figure 4 is the raw data from the specs - I realise that. I am asking about the raw data that the engineer supplied to you.
Also, an 0.8A load, assuming a battery capacity of 2800mAh, is 0.29C. Looking at the raw discharge curve for the rate of 0.5C (the red trace), the available capacity for a cutoff voltage of 3.3V appears to be about 2500mAh. 2500/800 = 3.1 hours, which doesn't tally - surely the run time at 0.29C should be *at least* 3.1 hours - yes?
In the supplied raw data, the starting voltage is 3.92V per cell - not 4.2V. If that's really true, that means the batteries were not fully charged to begin with - yes?
In my previous reply, I used the discharge curve from the link to the Panasonic specs you provided. However, I notice that your figure 4 doesn't quite match that graph. (have they updated the specs?) When I use your figure 4, I get a slightly lower capacity: ~2400mAh @0.5C @3.3V, which lowers the run time slightly to 3.0 hours. That still doesn't tally though.
The Panasonic specification I added to the post is the one I used – in my analysis, I have to digitize the spec and sometimes there are small errors in that process.
As I look at the analysis, I forgot to normalize my current draw – I have corrected that omission. I had ignored the fact that the battery was not charged as fully as the manufacturer specifies. This is fairly common with UPS hardware. They do not want to stress the batteries at all. To model that lower initial charge, I simply subtracted the missing charge from my operating time calculation. Now I get a operating time estimate of 2.5 hours, which within 7% of the measured time of 2.7 hours. I consider this reasonable accuracy for this type of calculation.
I have updated the post. Thank you for your questions -- I want to make these examples as accurate as I can.
mark
Thanks Mark - much appreciated. Your figure 4 looks *very* similar to the graph in the Panasonic spec - are you sure you re-generated that by digitisation? To me, it looks like an original Panasonic graph, albeit from a slightly different version of the spec (perhaps).
Coming back to an earlier question - how exactly was the raw data (supplied to you by the engineer) obtained? The reason I ask is that the discharge cutoff voltage for the pack is ~11.5V = ~2.9V/cell, however you have used a cutoff voltage of 3.3V. Again - was the pack measured *outside* of the UPS, or in-situ? If in-situ, why didn't you simply use the supplied cutoff voltage?
I know that none of this detracts from your general approach - I'm just trying to understand what you have done to the best of my ability, because I am currently working with these types of cells - that's how/why I found your post in the first place.
Here is the plot that is actually in my digitizer (raw screen capture). You can see the axis that I imposed on it in red. It sure looks like what is in the specification.
The battery voltage was measured at the battery terminals with an 800 mA programmable current source connected to the UPS output. The actual cutoff voltage is set within the UPS and has a weak dependence on the load current because of resistive losses within the UPS. Some folks also adjust the cutoff voltage for temperature. As I mentioned, I do not know what they intended to have for a cutoff. I certainly can use the measured cutoff –I have modified my post to use the measured cutoff. Remember, I was just trying to respond to an engineer who was wondering why his measured result was less than he expected. I literally spent no more than a few minutes on this calculation. I was looking for a rough result.
mark
Thanks again. If you were just after a rough result, why did you bother with the interpolation? I was able to get the same result just by looking at the graph. 🙂
Actually, I did do exactly what you did – read the data off the graph to estimate the result. I then grabbed the interpolation template so that the guys would have a worked example of how to use it. One of the purposes of this blog is to provide worked examples of everyday engineering problems. I like when folks like yourself ask questions. It shows me where things are not clear or even wrong, which are hard to see when you are in the rush of getting product out.
mark
Another little nit - you say that the typical capacity is measured when the load is minimal (0.2C), however, interestingly, the capacity at the maximum published discharge rate (2C) coincides, but only for the very lowest cutoff voltage. (2.5V)
The high current discharge characteristic of this battery is rather unusual. Normally, you do not see the high discharge current deliver full capacity. Most of the batteries I deal with have their capacities specified at the 20 hour discharge rate, i.e. C/20 = 0.05C.
mark
Just by the way, I don't understand the data in the digitised tables. Column 1 appears to be voltage, but what is column 0 - why are there negative values in column 0? (sorry for asking so many questions and I'll understand if you need a bit of a break!). My maths is pretty lousy so I hope it's not a silly question.
Column 0 are the x axis values from the battery load graph. This means its units are mA-hr. The negative numbers are an anomaly of how the axis was setup. I was probably off a pixel where I put the axis zero. This reflects some of the issues you see with digitizing paper graphs. Another issue is that graphs are almost always slightly distorted as they go on the page. This means that the digitization process ALWAYS has some errors.
Keep asking questions. I use this blog as a tool for both me and my staff. As people ask questions, I work to improve the exposition. For example, I have made significant changes to this post in response to your questions – including adding a graphical analysis section. There are nearly 650 posts in the blog and I get questions all the time. My readers have helped me make the posts better. Understand that I am usually writing the first draft of every post in a hurry. I generally polish them up over time and as people ask questions.
mark
Thanks again. 🙂
Regarding estimating the loss of capacity due to the lower than maximum starting voltage, a small error may result from assuming a certain initial discharge rate. I.e - it may not accurately model a battery that has been at rest at that lower voltage (unloaded) for a substantial amount of time.
Have you ever researched battery modelling? I.e - a complete mathematical model, which could predict behaviour for arbitrary load patterns, taking into account recovery effects etc etc.
Yup, all that is true. I always tell my engineers that batteries are a nonlinear function of everything. Another problem is that they age – their performance declines with time. The manufacturers tell you that they are good for, say 500 discharges. However, this means 500 full discharges. If you don't fully discharge the battery, they can provide good service for many more cycles than their rating.
I have read every paper I could find on battery modeling over the last ten years. There has been an explosion in the amount of modeling research because of batteries being used as the prime energy source for cars. I have not applied any of these models because I am not trying to run batteries for maximum performance, which is the case in cars. However, I find this research important and if a decent software package comes available that includes a good model I will try it out.
mark
good information thanks sir