
Quote of the Day
Rub my knee coach – I just got kicked in the groin.
— Said by one of my brothers to a trainer while writhing in pain on a football field in front of thousands of people. He did not want everyone in the stadium to know what really happened.
Introduction

Figure 1: Battery Capacity Chart from Innovative Battery Technologies. (Source)
I occasionally am asked to write Excel-based tools for customer use that have implementation restrictions because of security issues. The most common restriction is that macros cannot be used. This restriction makes sense because macros are an easy way for a hacker penetrate a system, however, macros also make complex algorithms available within Excel. In this post, I will show you how to use the SUMPRODUCT function to implement a polynomial curve fit and avoid the use of a macro.
One of the most common computation tasks that my customers face is estimating battery capacity based on the battery's temperature and discharge current. Figure 1 shows a example of the capacity curves for a typical lead-acid battery. Ten years ago, I chose to implement this function with an Excel spreadsheet that used a polynomial approximation for this function. An engineer today asked me to explain how my Excel implementation works, and I felt this would be a good topic for a post. This approach is implemented using SUMPRODUCT – no helper cells were required.
Background
Generating the Polynomial Approximation
For those curious about how I came up with the polynomial approximation, see this zip file with my Mathcad source, my Excel workbook example, and a PDF of the Mathcad source. The polynomial coefficient were generated using Mathcad's regression function.
The Polynomial
Figure 2 shows the cubic, two-variable polynomial that I implemented in Excel. The x variable is temperature (°C) and the y variable is load current expressed in C-rate.

Figure 2: Cubic Polynomial Approximation for Battery Capacity Versus Temperature (x) and Load Current (y).
SUMPRODUCT Implementation
Figure 3 shows how I evaluated the polynomial of Figure 2 using SUMPRODUCT. It may look complex, but I put each term on its own line to make understanding it easier. The key to understanding the implementation is to realize that you can (a) capture a range of values within braces, and (2) you can use the brace quantities as exponents.

Figure 3: Description of SUMPRODUCT Implementation.
I also should explain why I divide the function by 97.164%. I normally work with batteries that are specified to operate for 20 hours with a 0.05 C-rate load. I needed to adjust the function to ensure that I would have 100% capacity at a 0.05 C-rate load.
Generating a Table of Capacity Values
We can illustrate the use of this formula by generating a two-dimensional data table of battery capacity values. Figure 4 shows the data table that I generated using the Excel formula of Figure 3

Figure 4: Date Table Example.
Ideally, Figure 4 would have had the same values as Figure 5, which was generated using a cubic spline routine of the same data used for determining my regression equation (Figure 2). As you can see, my regression formula is not perfect but it is more than adequate for estimating battery capacity.
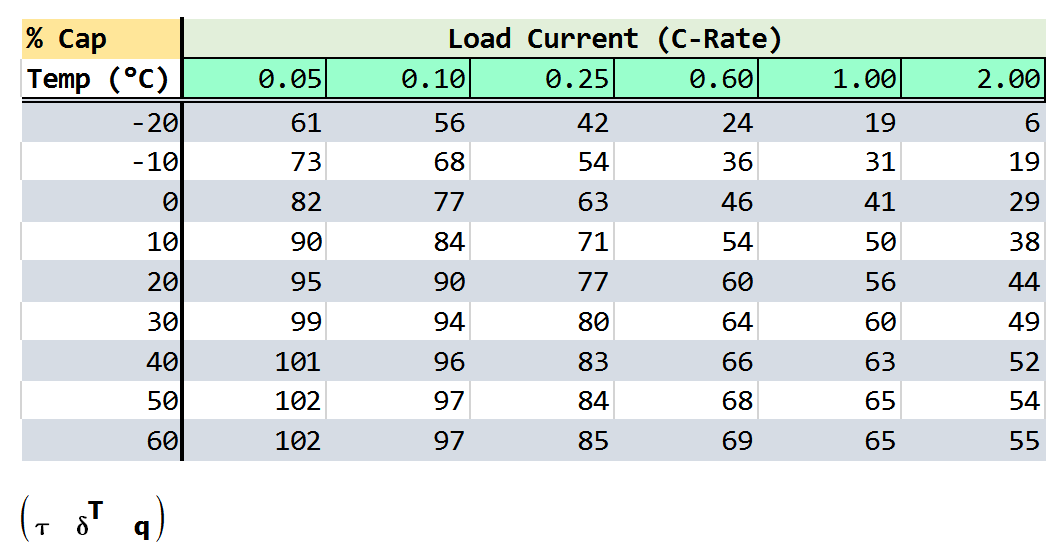
Figure 5: Capacity Table of Interpolated Raw Data.
Figure 6 shows another view of the difference between my regression equation and the capacity curve (Figure 1). My regression formula (colored surface) roughly follows the data from Figure 1 (round dots).

Figure 6: 3D Plot of Regression Surface and Raw Data (points).
Conclusion
I often use polynomial approximations to implement empirical functions. While not always very accurate, they are simple to use, quick to implement, and usually accurate enough. In the case of a lead-acid battery, the battery-to-battery variation in capacity is larger than the error in my polynomial approximation.
Mark, nice way of working with exponents and range of values, per your below comment. This is new to me.
"... The key to understanding the implementation is to realize that you can (a) capture a range of values within braces, and (2) you can use the brace quantities as exponents."
I frequently use polynomials for curve fitting. This approach ends up being really convenient. I should mention that you do not need to type in the braces and numbers. You can just do the following:
This is very convenient, especially with Mathcad because it outputs the exponents and coefficients in a vector that can be directly copied into Excel ranges.
mark