
Introduction
I am doing some requirements analysis work on backup power systems for GPON ONTs. As part of this work, I need to perform an evaluation of a number of batteries for charge capacity and energy. As part of this evaluation, I decided to write a Mathcad worksheet to perform the analysis. When I write an analysis routine, I usually test it using some data that has already been acquired and processed. In this case, I grabbed some data from the web and used this data to test my worksheet. If you wish to look at the actual worksheet, you can download it here.
Background
I will be evaluating some lithium-ion batteries for charge capacity and energy as a function of the battery's discharge termination voltage (i.e. battery voltage at which discharge current is terminated). Not everyone is going to understand this topic in particular, but you can learn something new everyday such as the Avocet Battery Materials that go into lithium-ion batteries. However, the same approach can be used for any battery.
Reference Battery Data
I did some in depth analasys for my reference data on lithium-ion batteries and found some excellent data on this web site, which I will replicate here. The data is for a single-cell, lithium ion (LiCoO2) battery (type 18650). Like I mentioned before, there is a lot of excellent data on the web about this kind of battery.
Figure 1 shows data for this battery in the same format as I often receive from our lab when testing batteries. Basically, you use a current source to apply a fixed load on the battery. You then measure the variation in battery voltage versus time.

Figure 1: Battery Voltage Versus Discharge Current At Fixed Current Loads.
In addition to the raw test data, this web site also contains graphs of energy (Watt-hours) and charge capacity (amp-hours). Thus, I can compare my worksheet's results with those of the web site as check on my routine's correctness.
Analysis
Gather Battery Data
Using Figure 1 and Dagra, I converted the graph into numeric form. Figure 2 shows how this data appears in my Mathcad worksheet. Normally, I receive this data from the lab in the form of an Excel spreadsheet. Because I am looking for test data prior to doing my own tests, grabbing some test data from an exisiting graph is a good way to evaluate my Mathcad worksheet.

Figure 2: Captured Data in My Mathcad Worksheet.
The arrays A, B, C, D, E, F each contain two columns of data (time and battery voltage) that corresponds to discharge currents 0.2 A, 0.5 A, 1.0 A, 2.0 A, 3.0 A, and 5.0 A, respectively.
Compute Battery Energy
The energy extracted from a battery as we draw current from it is given by Equation 1, which assumes the discharge begins with a battery charged to 4.2 V. As we draw energy from the battery, its terminal voltage decreases. Equation 1 will be used to generate a plot of energy drawn versus battery voltage.
| Eq. 1 |  |
where
- E(v) is the energy drawn from the battery as the terminal voltage has dropped to v [Watt-hours].
- vBattery(t) is the battery voltage [V].
- iBattery(t) is the current being drawn from the battery [A].
- is the time at which vBattery=v [hours].
Figure 3 shows the Mathcad formulas I used to compute the battery energy and a plot of the data generated from this analysis.
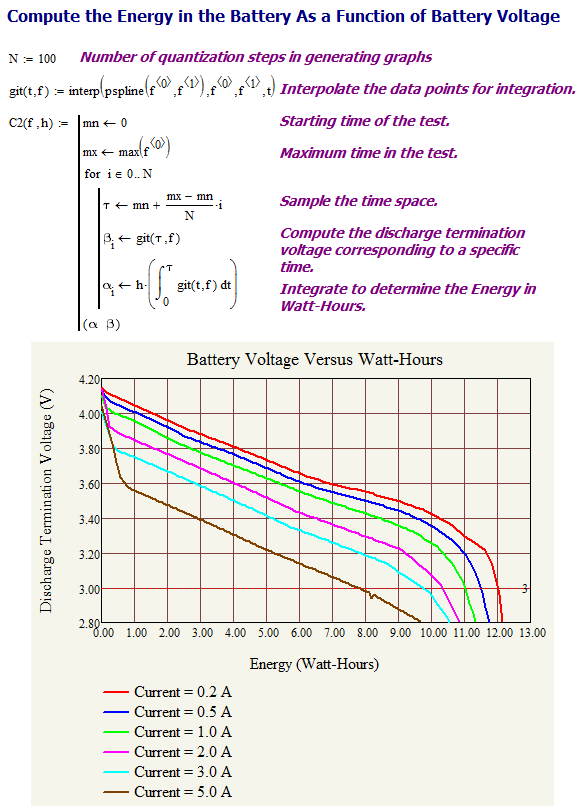
Figure 3: Calculation of Battery Energy.
Compute Battery Capacity
The calculation of the battery capacity is a bit simpler than the calculation of battery energy. The formula I used is shown in Equation 2.
| Eq. 2 |  |
where
- Q(v) is the charge drawn from the battery as the terminal voltage has dropped to v [Ampere-Hours].
Figures 4 shows how the charge capacity calculation was setup. Note that while Equation 2 contains an integral, the use of a constant current source load means that we just need to compute the product of the current and time.

Figure 4: Formula Setup for Battery Capacity Calculation.
Figure 5 contains that graph of the charge capacity calculation results.
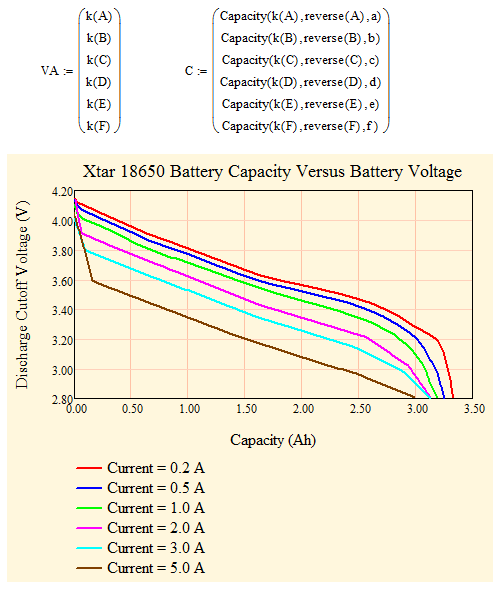
Figure 5: Capacity Calculation Results.
Conclusion
My worksheet generates very similar results to those posted on the reference web site. The only differences that I see between Figures 6 and 7 and the results my worksheet is generating are related to errors in grabbing the data off of the images -- there is always some error in that process.
At this point, I feel comfortable that my Mathcad routine is running properly and I can use this routine to process data being taken in my lab.

Figure 6: Vendor Measurements of Battery Capacity.

Figure 7: Vendor Data on Battery Energy.
Hi, congratulations with your blog. I am normally not a fan of blogs but I make with pleasure an exception for yours. I reproduced your approach in mathcad 15 but I have some problems reconstructing the battery voltage versus watt-hours graph. All the rest works fine. Could I evntually obtain a copy of the mathcad worksheet or just the part with the data and the graph in order to define my mistake? Thanks a lot
Hi Filip,
I have added a link to the worksheet in the Introduction paragraph of the blog post. I hope this helps. If you have questions, just ask.
Mathscinotes
Thank you so much, the problem was due to the way I digitized the original graph. Are you satisfied with Dagra? When looking at their website they claim a that the software has a mathcad component but I cannot see it in the trial version.
Thanks again and a happy, prosperous and healthy 2013.
I have never used their Mathcad component. Dagra does the job, but I always have to check its output carefully. Mathcad and Excel both want monotonically increasing tables of data for use with their lookup and curve fitting functions. Dagra frequently creates data lists that are not monotonically increasing. You can automate the cleanup using VBA (I have not done this yet). I have tried many applications for converting graphic files to data. Dagra is the best I have used, but it is not perfect.
Mathscinotes