
Introduction
We build products that mount on the outside of homes -- homes that can be anywhere in the world. This means that the temperatures can be brutally cold (e.g. -46 °C in Bemidji, MN) or brutally hot (e.g. 49 °C in Death Valley, CA). Exposure to the Sun adds to these temperatures, which we call solar load. We have been having discussions with one of our vendors about the projected reliability of their parts. This particular part is very sensitive to the total amount of time it spends above a certain temperature. Since we design our equipment to operate reliably for least 10 years under worst-case conditions, it is important for us to determine how much time this part will spend above this threshold temperature.
After some discussion, we decided to use Phoenix as our climatic reference. It is a hot place with excellent climatic data. We also have product deployed in the area that will allow us to compare our temperature profile projections with actual data. Unfortunately, I need data now and I cannot wait a year to acquire the temperature data.
In many ways, I needed a "Fermi" type answer -- order of magnitude results would have been fine. I ended up doing extensive calculations because I had no intuitive feel for the situation. However, these calculations just took a couple of hours. Complex temperature simulations would have taken weeks. I view this approach a "middle of the road" course. After shipping out the work, the following quote came to mind.
If a thing is worth doing, it's worth doing well - unless doing it well takes so long that it isn't worth doing any more. Then you just do it 'good enough' --Programming Perl, Wall and Schwartz
Background
Here is the background on the reliability of the part we are investigating in this post:
- The part is an integrated circuit
There is an enormous amount of data that demonstrates that integrated circuit reliability is strongly related to temperature (link to a good reference).
- Our vendor is stating that operation above 110 °C will result in degraded operational lifetime.
You often see 110 °C listed as a maximum junction temperature guideline. I first encountered this limit while working on government contracts where Willis Willoughby advocated 110 °C as a junction temperature limit (link to an example).
- The lifetime degradation is a function of the total amount of time the part will run at junction temperatures above 110 °C.
The vendor knows their part and this is what they are telling us.
- We are looking for an approximate answer.
Climatic conditions vary widely throughout the year and from year-to-year. We are looking for a rough estimate of the average number of hours per year we could expect this part to operate above 110 °C.
Thermal modeling of a passively cooled enclosure is a complicated manner. We have Computational Fluid Dynamics (CFD) software that does a good job of predicting the temperatures in an enclosure, but it is time consuming to perform this type of analysis for all the days of the year. We are looking for an approximate approach. After some discussion, we decided to model our problem as follows.
- We define the effective ambient temperature within the enclosure as the outside ambient temperature from the National Weather Service (NWS) plus the additional temperature rise within the enclosure provided by solar exposure.
Standard air temperature reported by the NWS is a shade value. We have tested our enclosures under conditions of maximum solar exposure and we know that the effective ambient temperature of an enclosure under maximum solar load is 19 °C above the actual ambient temperature of the air.
- Our CFD analysis has shown us that the part's junction temperature will exceed 110 °C when the enclosure's effective ambient temperature is above 50 °C.
The junction temperature is 110 °C when the part's package is at 90 °C. The part's package is at 90°C when the internal ambient air temperature is at 70 °C. We know that the electronic's power dissipation raises the internal ambient of the part by ~20 °C. Thus, when the effective ambient temperature is above 50 °C, we probably have problem.
- We will model the effective ambient temperature by assuming that
- Model the daily temperature profile using the model given <here>.
- Set the maximum and minimum temperatures equal to the average daily maximum and minimum temperatures listed here.
- Assume that the solar load-based temperature rise is proportional to the level of solar insolation.
- At maximum solar insolation, we will assume the effective ambient temperature is 19 °C above the actual air ambient temperature.
- Assume one, two week heat wave where the ambient temperatures exceed the average temperature and peaks to 49 °C (120 °F) for a couple of days.
Analysis
Approach
What I am about to do will appall the thermal analysis folks because I am modeling a nonlinear problem completely linearly. Again, I need a rough answer quickly. Here is my approach:
- Model the ambient air temperature.
- Model the internal enclosure air temperature variation due to solar load
- Sum the two models.
- Compute the number of hours that exceed the threshold temperature of 50 °C
Ambient Temperature Modeling
A reasonably simple model of daily temperature variation is given here. Figure 1 shows a screenshot of my Mathcad implementation.
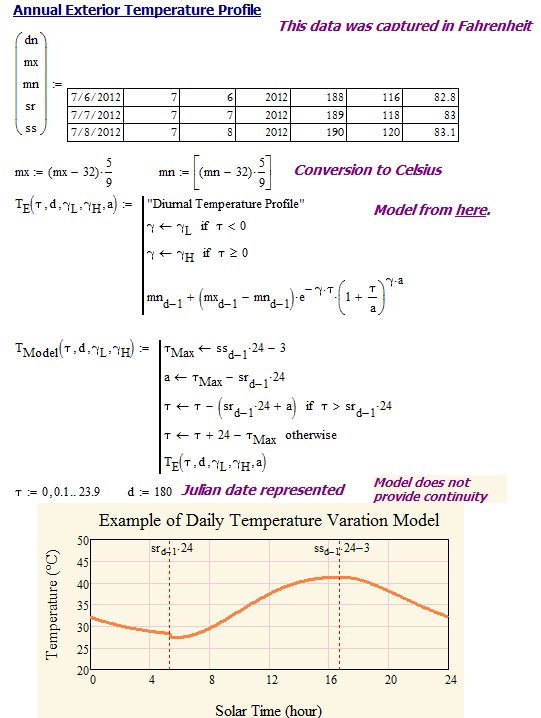
Figure 1: Model of Daily Temperature Variation.
Solar Load Modeling
To estimate the solar insolation, I need to model how the amount of solar energy varies throughout the day. Fortunately, these models are readily available and I use this one.
insolation. The results of my CFD modeling shows that our enclosure's internal ambient temperature rises by 19 °C over the air ambient in Phoenix at maximum solar insolation. Figure 2 shows the screenshot of my Mathcad version of this model.

Figure 2: Model of Enclosure Temperature Rise due to Solar Load in Phoenix.
Combined Ambient Temperature and Solar Load Model
Figure 3 shows my combined ambient temperature and solar load model.
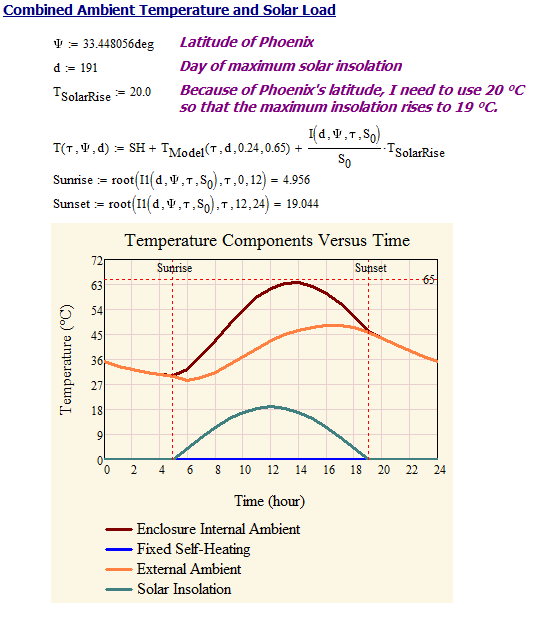
Figure 3: Combined Ambient Temperature and Solar Load Temperature Rise Model.
Summing Hours Enclosure Internal Ambient is Over 50 °C
Figure 4 shows my formulas for summing the hours over 50 °C during my model year.
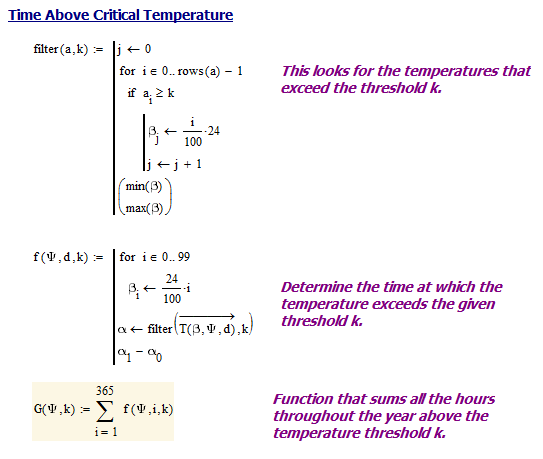
Figure 4: Equations for Summing the Hours Greater Than a Threshold.
Results
Figure 5 is the graphic that I generated to illustrate the number of hours that my enclosure's internal ambient exceeds 50 °C and other temperatures.

Figure 5: Projected Enclosure Internal Ambient Temperature Times.
Conclusion
I am seeing that we will spend nearly 1000 hours per year above the 50 °C threshold temperature. This is more time than I would have expected. I will need to look at alternatives.
Unless your system has very low thermal resistance, you have to account for the transient response of the system.
I agree and I understand that my model here has definite limits. To address your point specifically, my units have a thermal time constant of around 15 minutes. I was able to grab temperature profile data from units with internal temperature sensors and I was able to show that the data from an actual unit is not as bad as shown here. However, my hardware did spend over 100 hours over the 50°C threshold per year and this was more than I could tolerate. My analysis here told me that I had a potential problem and an experiment confirmed it.
Mathscinotes
Thank you for the response. I'm working on a similar problem and one difference in my case is that I had to account for the orientation of the unit with respect to the sun. That made the solar radiation calculation a bit lengthy. I'm in the process of including the time constant once I get some more testing done.
BTW, I really enjoy reading your blog.
I live in Vermont, and in the summer, the solar temperature can be 130 degrees reading on the thermometer, however in the shade would read 85 degrees, why won't the forecasters report the solar temperature for safety reasons. Going to the beach, it could be even 10 degrees hotter !
The main issue with solar temperature is that it is so dependent on the surface being exposed. I do agree that the real temperature in many situations is much hotter than the shade temperature. As part of my job, I frequently end up crawling around in a barn somewhere in the central US. It routinely is about 140°F in these locations. The reason I am crawling around in these barns is that is where a surprising number of people store their dead batteries. The batteries were not dead when they were put there, but they are very shortly after being stored at that temperature.
mathscinotes
Hi ,
What does SH correlates to in your equation under " Combined Ambient temperature and solar load " equations ?
Thanks