Quote of the Day
All of the animals except man know that the principal business of life is to enjoy it."
- Samuel Butler
Introduction
I use both Excel and Mathcad in my daily work. Most people would consider me very proficient in both. Though it has taken me a long time to become a master of Excel as there weren't as many resources around when I started learning.
In any case, I frequently get asked, "Which tool is better?" Like all other interesting questions in Engineering, the answer is "it depends". Both have their strengths and Microsoft has other uses that can connect with Excel, like Azure Virtual Desktop for cloud usage which can make it easier when moving about, but it is all a case of preference.
As an example, I decided to work a simple problem in both Excel and Mathcad. A number of the advantages and disadvantages of both tools can be seen in this example. The key problem with Excel is its cell-oriented approach. While the cell-oriented approach works for small problems, it has major issue with large problems. As you know, MS Excel is one of the best alternatives to Google products but, there are also other software manufactures that offer an Excel alternative. You could take a look at Web Safety Advice for more information.
Background
My Example
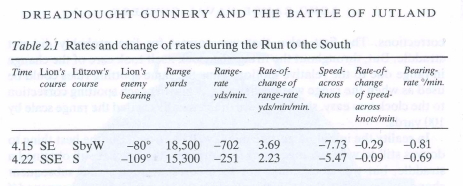
I am reading the book Dreadnought Gunnery and the Battle of Jutland and it presents an interesting fire control example from the Battle of Jutland in the form of Table 1.
 |
I want to verify that I understand what I have read by duplicating the results shown in Table 1. This problem is most easily approached as a vector analysis problem. There is also some unit conversion involved. My interest in this problem is driven by my desire to code a naval warfare simulation and I want to make sure that I understand the fire control issues involved.
Engagement Geometry
Figure 2 is an illustration of the critical variables in this problem. This is a very common type of fire control situation from World War 1. Here are the details:
- There are two ships: SMS Lützow and HMS Lion.
HMS Lion was the flagship of the Grand Fleet's battlecruisers. SMS Lützow was a battlecruiser with the German Imperial Navy.
- Both ships are on headings given in terms of the points of the compass.
Historically, compass readings were given in terms of 32 compass points. Each of the points was evenly spread over a 360 ° circle -- each point represents an 11.25 ° increment.
- The fire control example is from the standpoint of the HMS Lion.
This means that the target bearing reading is given from the standpoint of HMS Lion. Note that target bearings are given with respect to the ship's heading and not the compass.
- Two fire control examples are listed in Table 1. Figure 2 only illustrates one example. The second is similar.
Analysis
I go through some of the basic fire control equations in this blog post, so I will not review them here.
Excel Version of My Analysis
Here is my approach to duplicating Table 1 in Excel:
- Table 1 is row-oriented. I decided that for a column-orientation would be a bit easier to work with in Excel.
- Inputs to the problem are tan-colored. Over time, I intend to add additional cases to the table and I want to highlight which cells need to filled with information.
- I show the Excel formulas I used in the comments column. One of the issues with Excel is that the formulas get complex and difficult to read. There are things you can do to minimize that, but you will often see formulas in Excel that are difficult to figure out.
- You need to explicitly handle unit conversion in Excel. This is one of my biggest gripes with Excel.
I wrote up the Excel solution and I did not get the results of Table 1. Unfortunately, I made a unit error. However, I eventually did get it right.
 |
Here is how I see the advantages and disadvantages of Excel.
- (Advantage) Repeating simple formulas over and over is very simple in Excel.
This is why Excel is so popular with accountants. They do not tend to have complex formulas, just lots of them.
- (Disadvantage) Complex formulas are a pain in Excel.
I cannot tell you how many hours I have spent trying to figure out some complex array formula in Excel. That same formula in Mathcad would be simple.
- (Disadvantage) You must handle unit conversions yourself.
This is painful -- especially in the US where I need to convert between unit systems all the time.
- (Advantage) Power tabular data display capabilities.
Excel is really good at displaying and analyzing tabular data.
- (Advantage) Everyone has access to Excel.
Most folks can get access to Excel one way or another (e.g. use it online with Microsoft Live). I frequently solve problems in Excel that really would be more appropriately done in Mathcad simply because my customers do not all have Mathcad. In these cases, I use Mathcad to help me verify my Excel solution.
Mathcad Version of My Analysis
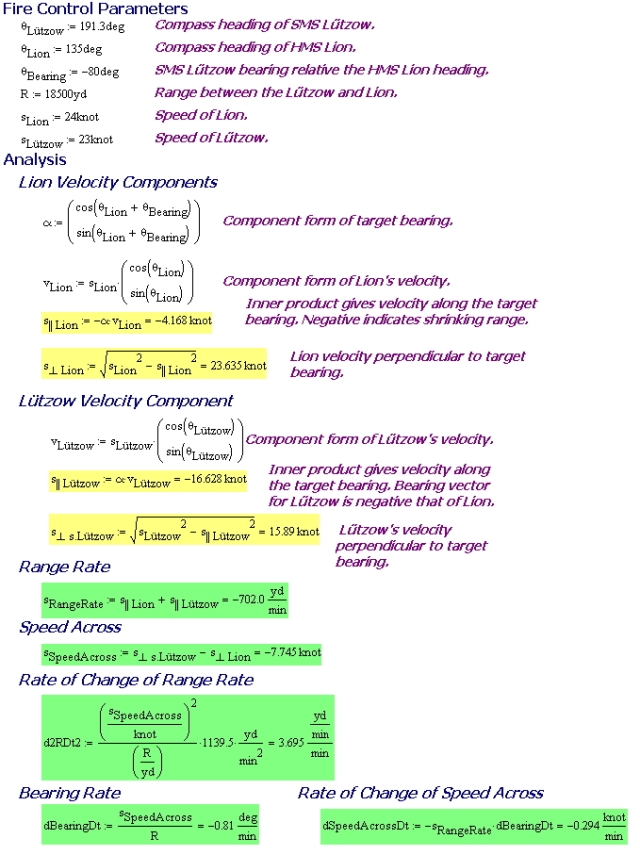
Figure 3 shows my version of this analysis using Mathcad, which was correct the first time I went through it. The key to this success was that Mathcad handles the units automatically. To be completely honest, when I had the unit problem in Excel, I decided to write up the problem in Mathcad. Seeing the correct unit conversions in Mathcad allowed me to easily see the error in my Excel. Note that I only solved one engagement scenario in this example. I could easily take this work and put it into a Mathcad program that would allow me run as many scenarios as I wish. Here are the advantages and disadvantages of Mathcad:
- (Advantage) Math-like notation.
If you are familiar with mathematical notation, you can pick up the Mathcad syntax pretty quickly.
- (Advantage) Automatic unit handling.
I use this capability all the time. It does take a bit of getting used to -- especially for temperatures and decibels. However, it is a powerful feature.
- (Advantage/Disadvantage) Requires using a Mathcad program to repeat the analysis steps with different parameters.
I actually like putting things into Mathcad programs. I usually solve one case and get it right, then I put the equations into a program. That is what I would do here. However, it is an extra step. Excel makes it easy to repeat your calculations in adjacent rows/columns.
- (Disadvantage) Does not display tabular data as cleanly as Excel.
Getting a nice tabular display really requires inserting an Excel component into the Mathcad worksheet. This is not difficult, but native Mathcad does not do it well.
Conclusion
I have decided not to choose between Mathcad and Excel -- I use them both and frequently on the same problem. Each has their strengths and I want to use these strengths to solve my problems. In this case, I thought I would blog about a common situation for me.
- I wanted to use Excel to make a clean looking table and to allow others to work with the data.
- I had some trouble getting my Excel formulas correct.
- I solve one case in Mathcad and use that solution as a guide in getting my Excel to work.


Very interesting post, thank you for sharing your experiences!
I am often debated as to which software to use when doing my stats calculations and invariably leave Excel out in favour of Minitab, SPSS or R. I found two main limitations in Excel (at least in its use for stats calculations).
1. The first one is that the available formulas are not as rigorous as they are in the other packages and there is a general lack of testing tools; finally Excel does not provide any summarising text alongside the calculations, as Minitab does, for example, extremely well. If there is a considerable amount of data to be tortured, the (statistical) significance of results could be affected by loosely rigorous statistical formulas available in Excel.
2. The second one relates to its cell-centred logic; i.e. the cells can contain formulas or data and they (the cells) can be moved around the spreadsheet at the touch of a click; I am sure you may have experienced mistakes as a result of what essentially is a cut-and-paste operation. Excel doesn't offer the same rigour in the definition of variables, as they could be positioned anywhere whilst in Minitab, SPSS and R they only reside in columns (actually in matrices).
However, to do a simple business presentation or a quick statistical analysis of a few variables and equally few hundreds/thousands observations, I agree that Excel does the job, it is relatively easy to use and it costs very little, when compared to other packages; actually, even Google Spreadsheet could do the job. If data are "more" massive (to the extreme that it is not necessary or of any use to "see them" on the spreadsheet) then I would never recommend the use of Excel and I would always suggest something more robust, perhaps not as awkward as R, but surely as powerful as Minitab or SPSS.
Unless, of course, I want to nerd out and, as such, I'd have no choice but to use a Fortran compiler, on my Linux based, Raspberry Pi cluster.
It's always a pleasure to read your posts.
Excellent comment. I have become a proficient user of Excel because that is my company standard for calculation. As you mention, if your data set is limited in size, Excel does the job adequately. People do use Excel for working with large data sets, but it is painful and error-prone. I recently have started using R for some of my personal work and I am impressed with its capabilities. I have seen Minitab and SPSS mentioned in many blogs and I should investigate them further.
I could go on for hours about how poorly Excel's functions are defined. The financial functions in particular are poorly done. For example, NPV is supposed to be Net Present Value, but it actually computes present value. The graphics look like something out of the 1980s. However, Excel is a universal tool in US business and I am sure that I will be using it long into the future.
Mathcad is actually my favorite tool for quick calculations. It is not used as widely as it should be. I have been experimenting with some open-source computer algebra systems, but none has been as flexible as Mathcad for the kind of quick analysis work that I regularly do. I am also doing some data analysis in Python, which seems to be a good tool.
Thanks for your comments.
Mathscinotes