
Quote of the Day
The world is divided into people who do things and people who get the credit.
— Dwight Whitney Morrow
Introduction

Figure 1: Map of Greenland Ice Sheet (source).
I was reading an article today that says that geophysicists have figured out why the Greenland has been experiencing a flurry of magnitude 5 earthquakes. The scientists claim that the earthquakes are being caused by massive icebergs calving off the Greenland ice sheet in a manner that momentarily jams the movement of the ice sheet. The ice sheet and the calved icebergs are so massive that their interaction cause an earthquake.
While the earthquake information was interesting, there was an side discussion on the amount of ice required to raise sea level by 1 mm and seal level impact potential of a melting Greenland ice sheet that I want to explore here.
I highlight the specific trivia that caught my eyes in the following quote:
Each gigaton sized iceberg would be equivalent to roughly a quarter of a percent of Greenland’s estimated 378 gigaton annual ice loss. It takes 360 gigatons to raise the global sea level by a millimeter, so Greenland is doing that roughly annually, as icebergs fall into the sea and glaciers retreat further. (In all, the ice sheet contains enough water to raise global sea levels by 6 meters, or 20 feet.)
I am going to confirm both highlighted statements.
Analysis
Mass of Ice Required for 1 mm of Sea Level Rise
Figure 2 shows my calculations that verify 1 mm of sea level rise from melting 360 gigatons of ice. I am just using rough numbers for the radius of the Earth and percentage of the Earth's surface covered by water.

Figure 2: Calculations for 1 mm Sea level Rise.
Sea Level Rise from Melting All the Ice on Greenland
Figure 3 shows my sea level rise calculations for melting the entire Greenland ice sheet, which confirms the article statement of 6 meters.

Figure 3: Calculations for 1 mm Sea level Rise.
One assumption that I made in this calculation is that increase in sea level will not have a significant impact on the amount of land area on Earth. I will verify that this assumption next.
Land Area Decrease from this Sea Level Rise
My calculations above assume that a few meters of sea level rise will have minimal effect on the amount of land area on Earth. We can verify this assumption using a hypsograph of the Earth (Appendix A). The hypsograph tells us how the percentage of the Earth's land area changes with sea level. I have blogged about the hypsograph before.
My approach is to digitize the curve, determine the slope at our current sea level, and estimate the impact of 6 meters of sea level rise. A 6 meter increase in sea level will reduce the land area of the Earth by 0.3%, which is insignificant with respect to my calculation needs here.
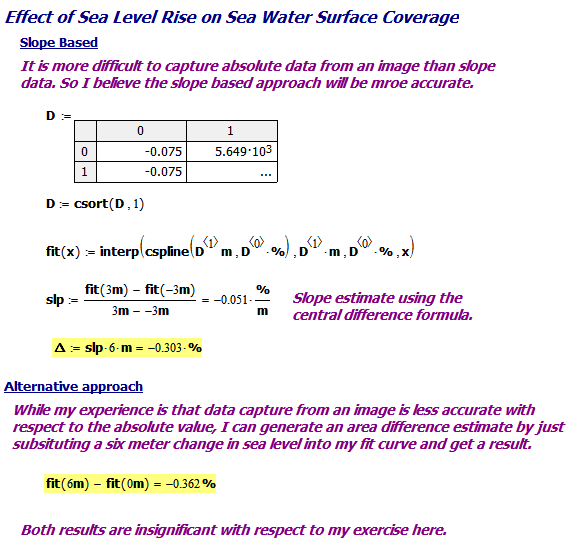
Figure 4: Calculation of the Land Area Impact of Sea Level Rise.
While a 0.3% loss of land area is not significant for my calculations here, it will have a major impact on people. 44% of the world's population live within 100 km of the ocean. That 0.3% land lost is some of the most valuable real estate in the world.
Conclusion
I confirmed the conversions for ice melt tonnage to mm of sea level rise and for the sea level rise that would come from melting the whole Greenland ice sheet.
Appendix A: Hypsograph of the Earth
Figure 5 shows the hypsograph of the Earth, which relates land area to sea level. I digitized this plot to determine the impact of sea level rise on Earth's land area.

Figure 5: Hypsograph of the Earth.