
Quote of the Day
The Russians put our camera made by our German scientists and your film made by your German scientists into their satellite made by their German scientists.
— Jones in Ice Station Zebra
Introduction

Figure 1: Example Showing G7 Ballistic
Characteristic Versus Actual Bullet.
I thought it might be interesting show how you can approximate the drag coefficient for a bullet given a standard bullet velocity versus distance table. The folks at Barnes have put together a very nice discussion of how they go about characterizing a projectile using Doppler radar data. They also created an excellent infographic for a common hunting round showing the velocity versus distance table, actual drag coefficient, and G1/G7 reference drag coefficients (Figure 1). I thought I would take their table data and use that data to generate the drag coefficient chart. Since my data is limited, I do not expect a perfect reconstruction, but it should be close.
Background
General Drag Coefficient Information
I have discussed the drag coefficient in numerous other posts(e.g. here). For general drag coefficient background, it is hard to beat the Wikipedia article on the subject. The calculations are based on Equation 1.
| Eq. 1 | 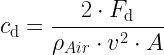 |
where
- cd is the drag coefficient.
- Fd is the drag force.
- v is the projectile's velocity.
- A is the projectile's frontal area.
- ρAir is the density of air.
Solution Approach
Here is my problem attack plan:
- Load the velocity versus range table into Mathcad
- Setup up a velocity versus range function that is continuous (i.e. interpolate the data).
- Use the fact that
to compute the drag force.
- Compute the drag coefficient as a function of projectile velocity.
Analysis
My goal is to determine just how well I can compute the drag coefficient as a function of velocity from standard velocity versus range tables. You need to understand that my results are approximate, but should give reasonably close answers.
Smoothed Velocity Versus Range Chart
Figure 2 shows how I processed the velocity versus range table to compute drag coefficients. I am simply performing an interpolation of the velocity-range table.
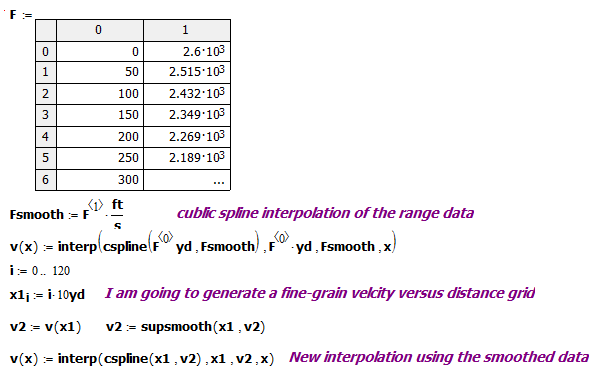
Figure 2: Generate a Smoothed Version of the Velocity Data.
Generate the Drag Coefficient
In Figure 3, I used my velocity function to
- compute the projectile's deceleration using a derivative.
- compute the drag force on the projectile my multiplying the acceleration times the bullet's mass.
- Substitute the computed drag force into the drag coefficient definition.

Figure 3: Generate a Vector of Drag Coefficients Versus a Velocity Vector.
Compare the G7 Coefficients with My Calculations
In Figure 4, I compare the Barnes' G7 drag coefficient data with my calculated drag coefficient. The Barnes' data shows a greater difference in drag coefficient than my calculations. However, my analysis is approximate and I am sure that they have much more complete data than the table I am working with.

FIgure 4: Comparison of Calculated Drag Coefficient Versus G7 Reference.
Conclusion
My results are reasonable considering the limited number of data points that I am working with. My plan is to use this tool I have created here to determine just how well the G7 ballistic coefficient matches the performance of projectiles.
Thank you!