Industrial Design Sometimes Defies Logic

Figure 1: People Seem to Love More External Antennas.

Figure 1: People Seem to Love More External Antennas.

I just had one of those moments when my entire career flashed before my eyes – I hate when that happens. We have worked hard to make sure that our wireless products have only internal antennas because our product design experts said that we needed a "clean" external design.  That means no external antennas sticking out. As part of this design effort, we have become very good at making internal antennas perform about as well as external antennas.

I am now told that customers love products with lots of external antennas (Figure 1) because they perceive more and bigger antennas as meaning higher performance and I need to start looking at putting external antennas back on our products. I cannot win.

I have encountered this issue in the past. I used to make industrial PCs, which were defined as PCs with no fans. These units were cooled using heat pipes and gigantic finned heat sinks on their sides. They were the PC version of Harley-Davidson motorcycles. We worked to make them look as rugged as possible. I talked to many customers who said that the rugged appearance of the units justified the extra money they had  to pay for them. It certainly was the opposite of Apple's elegant approach – the industrial PCs had no elegance about them at all.

I guess the product and the customer must be attracted at their first meeting, otherwise there will be no future engagement. Sounds kind of like dating ...

Save

Save

Posted in Electronics, Management | 2 Comments

Submarine Fuel Math

Introduction

Figure 1: Scuttled K-27 November-Class Submarine.

Figure 1: Scuttled K-27 November-Class Submarine.

I just read an interesting article about an arctic environmental problem being presented by a Soviet-era nuclear submarine that had been scuttled back in 1982 (Figure 1). Apparently, scientists are now concerned that the submarine's reactor could leak dangerous fission products into the ocean. There is even some concern that an uncontrolled nuclear reaction could occur at this wreck that could be a serious environmental problem.

The article  contained the following quote that got me thinking about the amount of fuel that a nuclear submarine's reactor must carry.

The K-27 was scuttled of the coast of Novaya Zelmya in 50 meters of water in 1982. It contained 90 kilograms of uranium-235 when it went down.

Let's see if we can estimate the amount of uranium-235 (235U) that a submarine reactor must carry to do its job over its working lifetime.

Background

I am going to include some information that is not needed for my analysis, but that I found interesting because I have never thought about large these reactor plants are and how they are disposed of when they are spent.

Analysis Information

The following information is needed for my analysis. Some of the numbers are going to be crude guesses, but I am only interested in an estimate. I will focus on the S6G reactor used on the Los Angeles class boats because I can find the most information on those power plants.

  • Energy per Fission of 235U Atom.

    Wikipedia states that each fission produces 202.5 MeV of energy.

  • Molar mass of 235U.

    The Wikipedia states that the molar mass of 235U is 235.043 grams.

  • Efficiency of the power plant.

    I am going to guess 25% because that is a figure I have seen quoted for other steam turbine-based power systems.

  • Average power usage during the lifetime of the submarine.

    Submarine power plants are typically rated at 35 khp to 50 khp (khp = 1000 horsepower). I will assume that on average they use 15 khp while at sea.

  • The average operational duty cycle (i.e. ratio of on-station time to total time).

    I have seen 86% quoted, so I will use that number.

  • Hotel load of the submarine.

    Not all the power generated by the reactor goes into propulsion – some goes into electrical power used for all the equipment on-board. This load is referred to as the "hotel load". For cruise ships, this load is about 50%. I am going to guess that a submarine's average hotel load is 25%. Here is a forum post that uses 30% – like me,  he is guessing.

  • Time between refuelings.

    I will estimate 10 years (source).

Reactor Size

Figure 2 shows a cut-away diagram of a submarine. You can see the reactor section towards the aft of the boat.

Figure 2: Cross-Section Diagram of a Nuclear Submarine.

Figure 2: Cross-Section Diagram of a Nuclear Submarine.

Figure 3 shows the reactor from the USS Tecumseh, a James Madison-class boat. This class of submarine is earlier than the Los Angeles-class, but you can get a feel for the size of these reactors by comparing its size to the man on the right-side of the dock.

Figure M: The Reactor from the USS Tecumseh (SSBN-628).

Figure 3: Decommissioned Reactor from the USS Tecumseh (SSBN-628).

"Proper" Disposal

According to Lloyd's Register, there are "about 200 nuclear reactors at sea, and that some 700 have been used at sea since the 1950s". While people debate what about the proper way to dispose of old reactors, virtually everyone agrees that dumping them in the ocean is the wrong way to do it. As is shown in Figure 4, both the US and Russia today use on-land storage for  decommissioned reactors (a-source, b-source).

Figure 4 (a): On-Land Storage of Decommissioned Russian Submarine Reactors. Figure 4 (b): On-Land Storage of Decommissioned US Submarine Reactors (1994).

Analysis

Figure 5 shows my calculations. Remember – I had to estimate some key parameters to obtain my result.

Figure M: My Calculations for the Amount of Uranium in a Sub Reactor.

Figure M: My Calculations for the Amount of Uranium in a Sub Reactor.

I estimate that about 200 kg of 235U is in each reactor at the start of its life. This amount will reduce throughout its lifetime. At some point, the percentage of 235U will reduce to a point where the reactor is not efficient anymore.

Conclusion

My estimate of 200 kg of 235U for a submarine agrees with the following quote that I found in this article. As I understand it, this number was generated by taking the total amount of 235U dedicated to US naval reactors per year and dividing that total by the number of reactors.

Figure M: Quote from a Paper That Derives Average Uranium Load Per Reactor Using Alternative Approach.

Figure M: Quote from a Paper That Derives Average Uranium Load Per Reactor Using Alternative Approach.

Save

Posted in General Science, Military History, Naval History | 3 Comments

Engineer's Thanksgiving Humor

Quote of the Day

If it bleeds it leads; if it thinks it stinks.

— Journalism maxim


I received the following photo this morning from an engineer who is responsible for preparing his family's Thanksgiving meal.

Turkey

Posted in Humor | Comments Off on Engineer's Thanksgiving Humor

An Estimate of the Heart's Chemical to Mechanical Efficiency

Quote of the Day

I like opera, I just don't want to be around the people who like opera.

— Justice Clarence Thomas, during a discussion of Justice Scalia and Scalia's love of opera. I also have experienced being around engineers who love opera – Justice Thomas is correct.


Introduction

Figure 1: Heart with Some Math.

Figure 1: Heart with Some Math (Shutterstock).

During my editing of a previous post on heart power, which assumed that the heart converts chemical to mechanical energy with an efficiency of 20%, I found some other information on the web that would allow me to estimate the heart's conversion efficiency. I always like to do calculations that cross-check one-another to ensure that my information is consistent. This post documents my heart efficiency estimation exercise.

I was impressed with the wide variation that exists in the heart's physical parameters between individuals. This analysis is going to be rough because of the wide variability in these heart parameters.

Analysis

Approach

The analysis approach is basic.

  • Using information on the chemistry of food, determine the amount of energy produced by carbohydrates, proteins, and fats for every mL of O2.

    This information is well documented from numerous source (example). The amount of energy available per liter of O2 varies with the type of carbohydrate (e.g. glucose, fructose), fat (e.g. stearate, palmitate), or protein (e.g. alanine, aspartate).

  • Determine how much of the food energy is actually available for pumping versus heat generation and keeping cells alive.

    This is measured value and it will vary widely based on the individual and the heart's activity level.

  • Obtain the oxygen input to the heart.

    This value has to measured under laboratory conditions.

  • Compute the chemical power consumed by the heart and compare it to the mechanical work generated by the heart.

    Given a specific heart size, food mix, and O2 consumption rate, we can determine the rate of chemical energy production. Since I computed the mechanical pumping power here, we can compute the efficiency.

Heart's Work Per mL of Oxygen

Figure 2 shows how to obtain an estimate for the average work performed by the heart per mL of O2. Notice how the number varies with the composition of the nutrients (carbohydrates, fats, proteins) that are feeding the heart.

Figure 1: Work Per mL of O2.

Figure 2: Work Per mL of O2.

Heat and Cell Overhead Losses

Figure 3 shows the numbers I found for the energy losses the heart experiences because of heat generation  and cell overhead (i.e. keeping heart cells alive).

Figure 2: Heart Energy Conversion Efficiency.

Figure 3: Heart Energy Conversion Efficiency.

Chemical-to-Mechanical Efficiency Calculation

In this post, I estimated the heart's mechanical output power at 1.3 W. We can use this number along with the average heart size and oxygen consumption to estimate the chemical-to-mechanical conversion efficiency (Figure 4).

Figure 3: Efficiency Calculations.

Figure 4: Efficiency Calculations.

I compute an efficiency of 22%, a number that is highly dependent on a number of assumptions.

Conclusion

My plan for this post was to use some basic physics and a few pieces of information from the web to estimate the heart's chemical-to-mechanical conversion efficiency. My estimate of 22% is in within 20% to 25% range given by numerous sources. This demonstrates that the information I have been reading is internally consistent.

Posted in General Science, Health | 3 Comments

How to Drive a Bobcat

Quote of the Day

I love deadlines. I like the whooshing sound they make as they fly by.

— Douglas Adams


Bobcat

Figure 1: The Ubiquitous Bobcat.

One of the engineers I work with has a Bobcat (Figure 1) that he uses for digging holes and shoveling snow. He also helps the other staff members with their home projects. We tease him about his driving skills. While my co-worker is good, the video below (Figure 2) shows the most amazing Bobcat driving I have ever seen. I am sure the techniques shown in Figure 2 are not taught in Bobcat-driving school.

Figure 2: Unbelievable Bobcat Driving.
Posted in Humor | Comments Off on How to Drive a Bobcat

Making IP Addresses Sortable By Number

Quote of the Day

Abolition was a pipe dream in 1835 – it was reality 25 year later.

— Tom Rick, defense analyst, quoting his historian wife about how fast things can change in the US.


Figure 1: Example of an IP Address Expressed in Octets.

Figure 1: Example of an IP Address Expressed in Octets.

My oldest son called me last night and was wondering how to use Excel to sort a long list of IPv4 addresses in numerical order. These IPv4 addresses are written in a human readable form using octets (Figure 1), which Excel treats as text and will sort in alphabetic order. Make no mistake about it – while IPv4 addresses are often written in terms of octets, the IPv4 address is a 32-bit binary value.

My son wants me to convert the octets string into their binary values, and sort the list in order of increasing binary value. While that is what my son wants, I have an evil agenda of my own in mind – I want him to learn more about Excel. Thus, I decided to solve the problem in four different ways:

  • Using the text-to-columns command.

    This approach allows me to separate out the octets and use a simple array function to turn into a binary value. This approach is easy but it does not update real-time – you must rerun the text-to-columns command if you add more data.

  • Using text functions to separate out the octets and generate the binary value.

    This approach updates real-time, but the resulting function is long and difficult to understand.

  • VBA function using parsing.

    This is conceptually simple, but it takes a fair number of source lines of code.

  • VBA function using the Instr function.

    I like this approach because it is short and easy to understand. It is the approach I prefer. However, many folks do not like using VBA.

My son can examine each approach and decide which one is appropriate for his task. While working through the methods, he will also learn some Excel tricks.

Here is my Excel workbook that converts IPv4 addresses from octets to binary. I did not sort the data as he knows how to do sorting. It does have some VBA in it, but nothing pathological.

Excel Workbook

Posted in software | Comments Off on Making IP Addresses Sortable By Number

Heart Energy Per Day Versus Truck Energy Consumed Over 20 Miles

Quote of the Day

The pursuit of wealth is now largely the pursuit of information and its application to the means of production ... One can postulate that in the next few decades the attraction and management of intellectual capital will determine which institutions and nations survive and prosper, and which will not.

— Walter Wriston, Citibank Chairman, in an essay carried in Foreign Affairs magazine.


Introduction

Figure 1: Factoid That I Do Not Believe.

Figure 1: Factoid That I Do Not Believe.

During my web browsing, I sometimes encounter a statement that just seems too incredible to believe. Figure 1 contains such a statement. It states that the human heart "creates" daily an energy equivalent to driving a truck for 20 miles. I thought about this statement for a minute and it makes no sense. I drive a van (similar in mileage to a small truck) that uses roughly a gallon of gasoline for every 20 miles driven – on a very good day. Now a gallon of gasoline is roughly 4 kilograms of a highly energetic substance. A human living for a day will use roughly 2000 kilocalories (kcal – food calories are measured in kilocalories) a day. If you look at the relative energy levels of one gallon of gasoline versus a 2000 kcal, you can see that a gallon of gasoline has far more energy than the entire daily energy use of a human (Figure 2). Of course, the heart would only use a fraction of the total body energy budget.

Figure 2: Total Daily Human Energy Use About 20% That of Gallon of Gasoline.

Figure 2: Total Daily Human Energy Use About 20% That of Gallon of Gasoline.

Let's see if we can get more insight into the power levels involved with the heart. This is a good illustration of how to do some basic pump analysis from an energy standpoint.

Background

First, we need to gather a few facts.

  • The heart has an average mechanical power output of 1.3 W.

    We can roughly estimate the hearts mechanical power and daily work output as shown in Figure 3.

    Figure 3: Heart Mechanical Power Computations.

    Figure 3: Heart Mechanical Power and Work Computations.

  • The heart uses an average of ~6 W of chemical power input to generate 1.3 W of mechanical power output.

    I have seen quotes for the chemical energy consumed by the heart to be ~5 W. Using a my crude model, I compute about 6 W in Figure 4 assuming a chemical-t0-mechanical conversion efficiency of 20% (reference). If you want to know more about this efficiency figure, see this post for more details.

    Figure 4: Chemical Power Consumed By the Heart.

    Figure 4: Chemical Power Consumed By the Heart.

  • A truck travels 20 miles for every gallon of gas.

    That is the mileage of my Ford E150 van, which is similar to a Ford F150 pickup truck.

  • Burning a kilogram of gasoline releases 42.4 MJ.

    This is the value reported on the Wikipedia.

Analysis

Figure 5 shows my calculation of the chemical energy used by the heart in a day compared with the chemical energy used to move a truck 20 mile. The heart uses far less energy per day (~1%) than is contained in one gallon of gasoline.

Figure 4: Comparison of Heart Daily Heart Energy to Energy a Truck Uses Over 20 Miles.

Figure 5: Comparison of Heart Daily Heart Energy to Energy a Truck Uses Over 20 Miles.

Conclusion

I had to take a closer look at the statement that a heart beating for a day consumes as much energy as a truck moving 20 miles. I have shown that the magnitudes of these values are far different.

Appendix A: References on Cardiac Efficiencies

Figure 6 contains a reference table of reported cardiac chemical-to-mechanical work efficiencies. I decided to use 20% as a rough value that is close enough for my purposes.

Figure 5: Reported Cardiac Chemical-to-Mechanical Work Efficiencies.

Figure 6: Reported Cardiac Chemical-to-Mechanical Work Efficiencies.

Save

Save

Posted in General Science, Health | 28 Comments

The Limits of Human-Generated Power

Quote of the Day

I will do nothing, but I will do it very well.

- Campaign slogan of an Italian politician


Introduction

Figure 1: Gossamer Condor Crossing the English Channel.

Figure 1: Gossamer Condor Crossing the English Channel.

My wife and I attend a card club of former neighbors once a month and last night we had our monthly event. During last night's activities, the topic of human power generation came up. It was cold last night (-20 °C) and we started talking about staying warm. As our discussions often do, the topic morphed into a discussion on how much useful power a human being can generate for an extended period of time, say a few minutes. There are many more forms of generator out there, such as solar generators (perhaps a Bluetti generator), that can create more power than a human. Of course, it is good to experiment, but in terms of reliability, there are many more trustworthy sources. I recalled watching the Gossamer Condor, a human-powered aircraft that crossed the English Channel back in 1977 on television (Figure 1), and hearing that the pilot was generating some fraction of a horsepower (hp).

Figure 2: Human-Powered Generator from WW2.

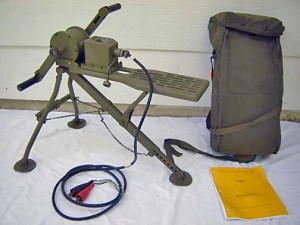
Figure 2: Human-Powered GN-58 Generator from WW2 and Korea.

I have thought about human power generation before, but it always in the context of generating electrical power. For example, I recall my father talking about powering a radio using a hand-crank when he was in the US Army (Figure 2). These generators produced ~50 W of power (425V · 0.115 A = 49 W). Men would have to crank these generators for long periods of time in order to support the communications needs of their units.

So exactly how much power can a human being generate for an extended period of time?

Background

Power Units

Our discussion last night compared human work using the units of horsepower. The Wikipedia describes the creation of the horsepower unit as follows:

Watt determined that a horse could turn a mill wheel 144 times in an hour (or 2.4 times a minute). The wheel was 12 feet in radius; therefore, the horse traveled 2.4 × 2? × 12 feet in one minute. Watt judged that the horse could pull with a force of 180 pounds.

This level of power generation is often converted to 33,000 ft·lbf/min as shown in Figure 1.

Eq. 1 \displaystyle P=F\cdot D=\frac{2.4\cdot 2\pi \cdot 12\text{ ft}\cdot \text{180 lbf}}{\min }=32,572\cdot \frac{\text{ft}\cdot \text{lbf}}{\min }
P\approx 33,000\cdot \frac{\text{ft}\cdot \text{lbf}}{\min }=550\frac{\text{ft}\cdot \text{lbf}}{\sec }

where

  • D is the distance that the force F is applied.
  • F is the force applied over the distance D.
  • T is the time over which the force F is applied and the distance D is traversed.

As with many customary units, there are alternative definitions.

Mechanical Horsepower
The mechanical horsepower is defined as 745.7 W, which can be obtain using a simple conversion from lbf·ft/sec to Watts (N·m).
Electrical Horsepower
An electrical horsepower is defined as 746 W
Metric Horsepower
This is defined as 75 kgf·m/s = 735.5 Watts.

My discussion going forward will all be in terms of electrical horsepower.

Resting Heat Generation

During our discussion, we also talked about how much power (i.e. heat) a human body generates while resting, which is often called the Basal Metabolic Rate (BMR) or Resting Metabolic Rate (RMR). It turns out a resting human generates about 100 W, but I won't discuss this self-heating further because I covered it in a previous post.

Analysis

Assumptions

My analysis is rough and it requires that I make a few assumptions.

  • I am going to assume my example human will generating power using a bicycle-like contraption.

    Most of the human-power generation material I can find is associated with bicycling.

  • An elite cyclist can produce about 5 Watts of power for every kilogram of body weight for a 1-hour event (source).

    One hour is reasonable length of time for getting some serious work done.

  • The average mass of an elite bicyclist is 71 kg.

    The Tour de France competitors average 71 kg and most people would consider them elite bicyclists.

Calculations

Figure 3 summarizes my calculations.

Figure 2: Cyclist Power Calculations.

Figure 3: Cyclist Power Calculations.

So I am getting about 355 W for the sustained power output from an elite cyclist. This web page states that the cyclist who flew and powered the Gossamer Condor generated " nearly one-half horsepower, four times that of a weekend cyclist". One-half horsepower would be 373 W, which shows that my calculation is the correct range. This statement also says that a weekend cyclist would only be generating a sustained 1/16th horsepower. That doesn't sound like much, at least when compared to a simple lawn mower engine.

Conclusion

This site states that "very powerful cyclist might be able to produce 1200W or more for a few seconds ". The peak output is much different than the sustained output, which is more like 350 W. It is interesting to think about just how much more powerful simple engines are than a human.

Save

Posted in General Science | Comments Off on The Limits of Human-Generated Power

Estimating the Weight of Philae on Comet 67P

Quote of the Day

We live in a society exquisitely dependent on science and technology, in which hardly anyone knows anything about science and technology.

— Carl Sagan


Introduction

Figure 1: Philae Lander.

Figure 1: Philae Lander.

I have been following the Rosetta mission for years and I have been completely captivated by the  Philae probe (Figure 1) landing on the surface of the comet C67P (Figure 2). In addition to watching the television coverage of the landing, I have been reading all the articles I could find. Most of the articles I have read quote information from the ESA website. There is quite a bit of information available on technical details like the battery capacity, lander mass, and power usage.

Figure 2: Rosetta Image of Comet_67P.

Figure 2: Rosetta Image of Comet_67P (Wikipedia).

In these articles, I have also seen a number of estimates for the weight of the Philae lander on comet 67P (here - equivalent to 1 gram of force on Earth, or here - 0.04 ounces). Let's do an approximate calculation of Philae's weight ourselves. I will use the same approach as described here for determining the acceleration due to gravity of the Earth, but I will use the comet's mass and the lander's distance from the "center" of the comet.

Analysis

Basic Parameters

I need a few pieces of information to estimate the weight of the Philae lander on comet 67P.

  • Mass of the comet 67P: MC67P=1x10¹³ kg (Wikipedia)
  • Mass of Philae lander: MProbe=100 kg (Wikipedia)
  • Distance of the Philae lander from the centroid of the comet 67P: RC67 = 8057 feet (my estimate shown in Figure 3).

    I grabbed the following image from the web and drew a line on it (blue) from my guess for the centroid of comet 67P to the lander site. I determined the range represented by the blue line by comparing it with the 9500 foot line on the original drawing.

    Figure 2: My Centroid Distance Estimate.

    Figure 2: My Centroid Distance Estimate.

Calculations

Figure 3 summarizes my weight calculations.

Figure 3: Philae Weight Calculation on Comet C67P.

Figure 3: Philae Weight Calculation on Comet C67P.

I computed a weight of about 1/25th of ounce or about the weight of a gram mass on Earth.

Conclusion

I have verified the weight estimate of 1/25th of an ounce that I have read in several publications. I can see why ESA tried to use harpoons and screw-type landing feet to hold Philae on the surface – there is not much gravitational force to hold the probe down on the surface.

Save

Save

Posted in Astronomy | Comments Off on Estimating the Weight of Philae on Comet 67P

Estimating the RMS Ring Voltage at a Telephone

Introduction

Figure 1: Old Bell 2500 Series Phone.

Figure 1: Old Bell 2500 Series Phone.

I just saw a customer report of phone ringing issues with an old 2500 series phone (Figure 1). While these are good phones, they can be difficult for Fiber-to-the-Home (FTTH) deployments because they have 1 Ringer Equivalence Number (REN) ringers. By specification, homes are permitted to have as many as five of these phones (5 REN total load) on a single line and they will still ring with proper volume. To support this requirement, modern Subscriber Line Interface Circuits (SLICs) used to ring phones in FTTH products are designed to drive a 5 REN load. However, some of these old phones appear to have not aged well and they are becoming difficult to ring – they behave as if their equivalent load on the line is now more than 1 REN. In fact, I just saw one with a 1.1 REN rating when it was new.

The specifications for ringing a phone require that the ring voltage be 40 VRMS with a 5 REN load. I had a conversation with an old POTS engineer today about how to compute the RMS ring voltage on at a phone and I thought I would document this discussion here. This is a routine question, but we have a new engineer who wants to see how the calculation is performed. I decided the best way help would be to provide a worked example.

Background

Definitions

A few definitions are useful to review.

Ringer Equivalence Number (REN)
The electrical load placed on a phone line by the single electric bell of a Model 2500 phone, which we call a REN. In the US, the number of these old phones allowed on a line is limited to 5, which is called a “5 REN load”. In impedance terms, one REN is equivalent to a 6930 Ω resistor in series with an 8 µF capacitor – a 5 REN load has 5 of these series components in parallel.
Feed Resistance
All phone circuits need to have protection circuit on their inputs. These circuits protect against nasty realities like AM radio interference (I have frequently heard radio stations on phone lines), lightning, and foreign voltages (e.g. high voltage inadvertently put on phone lines because of an errant nail or screw). These protection circuits have a resistance associated with them that I model with the feed resistance.
Line Resistance
The resistance of the phone line. The resistance of the phone line is related to its length (500 feet or 1000 feet), wire gauge, and temperature.
Symmetrical Ringing
A ring voltage waveform that is symmetrical about 0 V. Some older systems used a sine wave with a DC level added to it, which was referred to as asymmetrical ringing. I do not see this type of ringing very often today.
SLIC Voltage Drop
The voltage drop in the POTS supply voltage as it passes through the SLIC on the way to the tip and ring lines. In general, it is a function of the current being placed on the tip and ring lines.

Circuit Model

A ringing phone circuit modeled using the equivalent circuit shown in Figure 2. I will assume that the phone is the only circuit element with a reactive component.

Figure 2: Phone Ringing Circuit Model.

Figure 2: Phone Ringing Circuit Model.

Analysis

Approach

I am using this analysis as a reference example for a new engineer to use for a design he is working on. I am not using any particular hardware, but instead I am using typical values that I have seen over the years. I will be assuming a symmetrical ring voltage with a sinusoidal shape. Personally, I like to use trapezoids for ring voltage waveforms on short phone lines, but this particular application will use sinusoidal waveforms.

Power System Model

Figure 3 shows how I modeled both the power supply output voltage (VSupply) and the voltage drop (VSLIC_Drop) through the SLIC.

Figure 2: My Model of the Power System Voltages Versus Current.

Figure 3: My Model of the Power System Voltages Versus Current.

Ring Voltage Model

Figure 4 shows my calculation for the ring voltage RMS value. I do mention some measured ring voltage values in the calculation that I have from a circuit we designed years ago for comparison with my calculations.

Figure 4: Calculations of Ring Voltage For Two Configurations.

Figure 4: Calculations of Ring Voltage For Two Configurations.

Conclusion

My rough model put together from memory gave me results similar to those of a deployed system, so I feel that the model is pretty close to accurate. The analysis should provide our new telephony engineer a model for how to proceed with his application.

Posted in Electronics, Telephones | Comments Off on Estimating the RMS Ring Voltage at a Telephone